จุดเด่นของ RE EARTH
แบบจำลองการปนเปื้อนและการพยากรณ์อนาคต

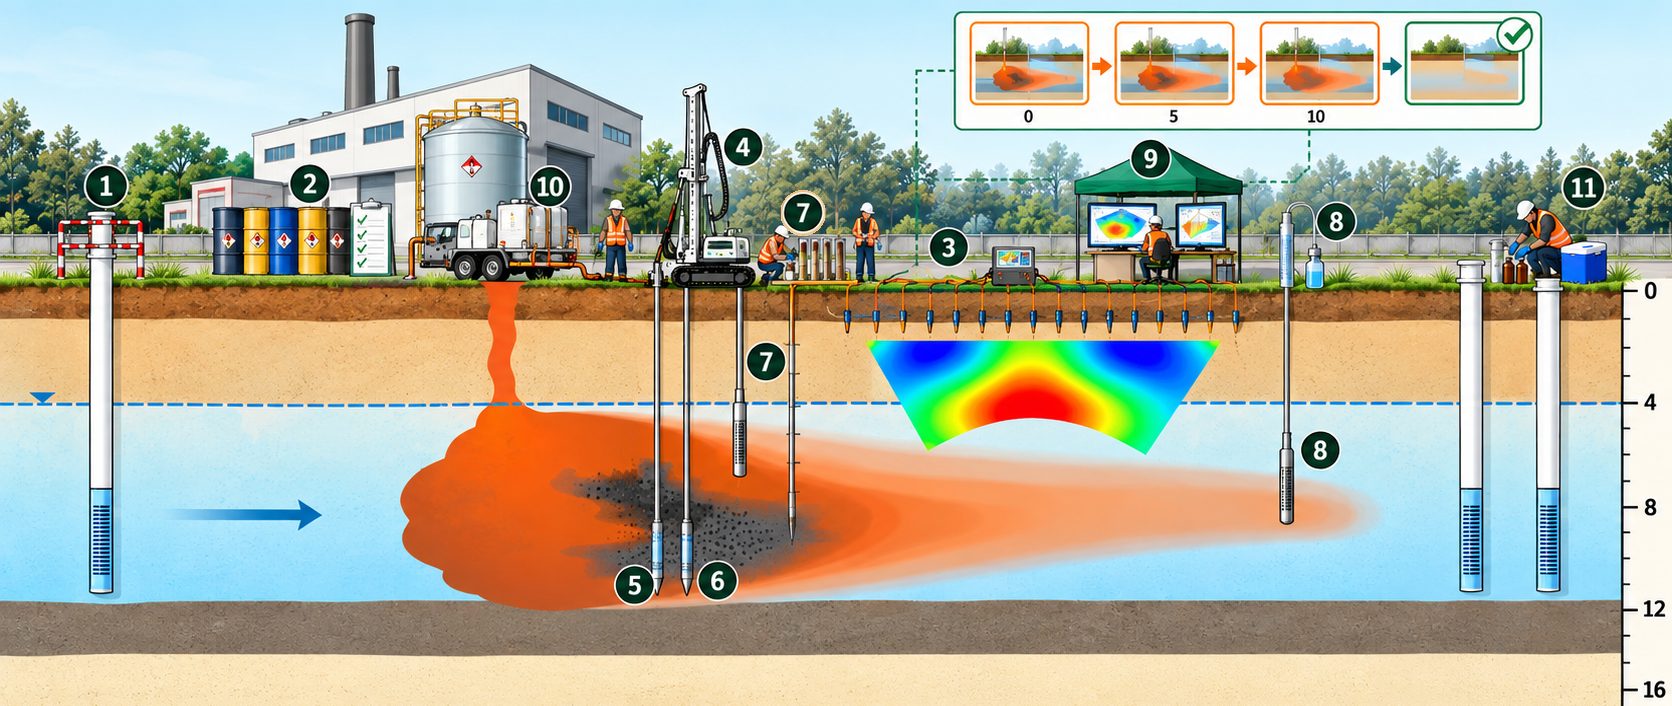
ปัจจุบัน → อีก 5 ปี หากไม่บำบัด → อีก 10 ปี หากไม่บำบัด → หลังบำบัด
นำผลการสแกน ERI ผลการตรวจวัด MIP และ HPT ผลวิเคราะห์ตัวอย่างดินรายระดับความลึก และผลวิเคราะห์ตัวอย่างน้ำใต้ดินจาก SP16 มาสร้างแบบจำลองสามมิติของชั้นดินและการปนเปื้อน ด้วยโปรแกรม Surfer สำหรับสร้างแผนที่เส้นชั้นข้อมูล และ Groundwater Modeling System (GMS) ของ Aquaveo เพื่อคำนวณการเคลื่อนตัวของสารตามการไหลของน้ำใต้ดินและพยากรณ์สถานการณ์ในอนาคต
ข้อมูลจำเพาะ
- ข้อมูลนำเข้า: ERI · MIP · HPT · ตัวอย่างดิน · SP16
- โปรแกรม: Surfer · GMS (Aquaveo)
- ผลลัพธ์: ขอบเขต 3 มิติ · มวลสาร · พยากรณ์ 5 / 10 ปี
ประโยชน์: ผู้บริหารและหน่วยงานกำกับดูแลเห็นภาพได้ชัดเจนว่า หากไม่ดำเนินการ สารจะแพร่กระจายไปถึงบริเวณใด และ หลังการบำบัดจะเหลือปริมาณเท่าใด ช่วยให้เปรียบเทียบทางเลือกการฟื้นฟูและตัดสินใจลงทุนได้บนพื้นฐานของข้อมูล
ตัวอย่างผลจากโครงการจริง
ผลจากการรวมข้อมูล ③–⑧ เข้าสู่แบบจำลอง
- VOCs สูงสุดในน้ำใต้ดิน: 99.37 mg/L (≈199× ค่ามาตรฐาน)
- VOCs สูงสุดในดิน: 52.8 mg/kg (≈7× ค่ามาตรฐาน)
- ความลึกของแหล่งกำเนิด: 8–11 m
- ชั้นดินเหนียวกั้น: 12 m
- รัศมีการปนเปื้อน: <100 m
- มวล VOCs ใต้ดินที่ประเมินได้: 4.31 ตัน
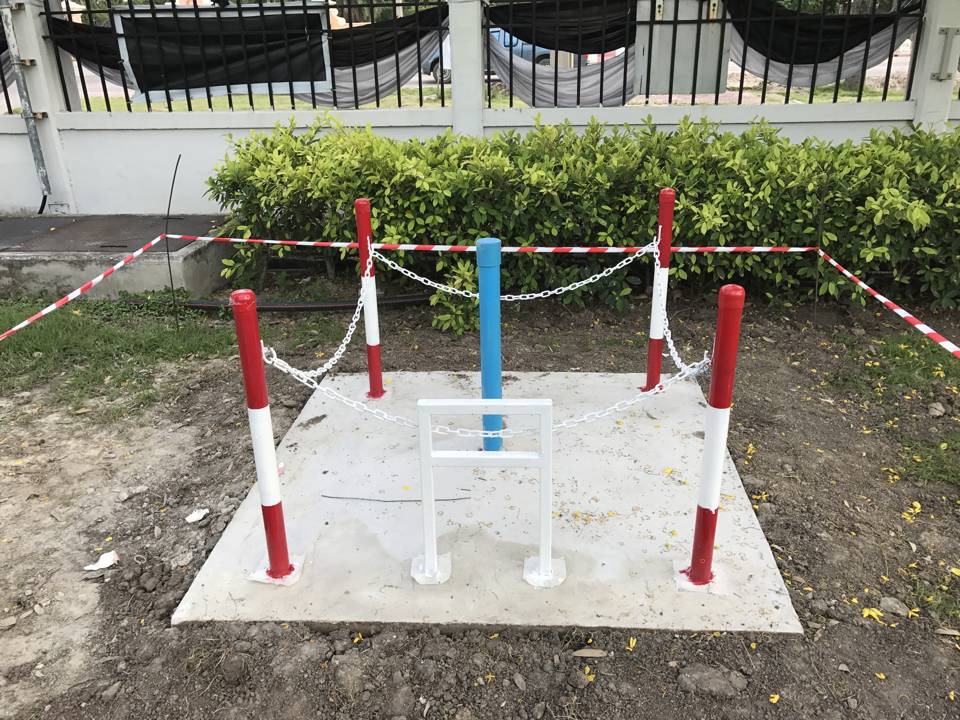
ข้อมูลชุดนี้ใช้ในการออกแบบการฉีดถ่านกัมมันต์แบบคอลลอยด์ ⑩ และกำหนดตำแหน่งบ่อติดตามผล ⑪
จากข้อมูลภาคสนาม สู่แบบจำลองพยากรณ์
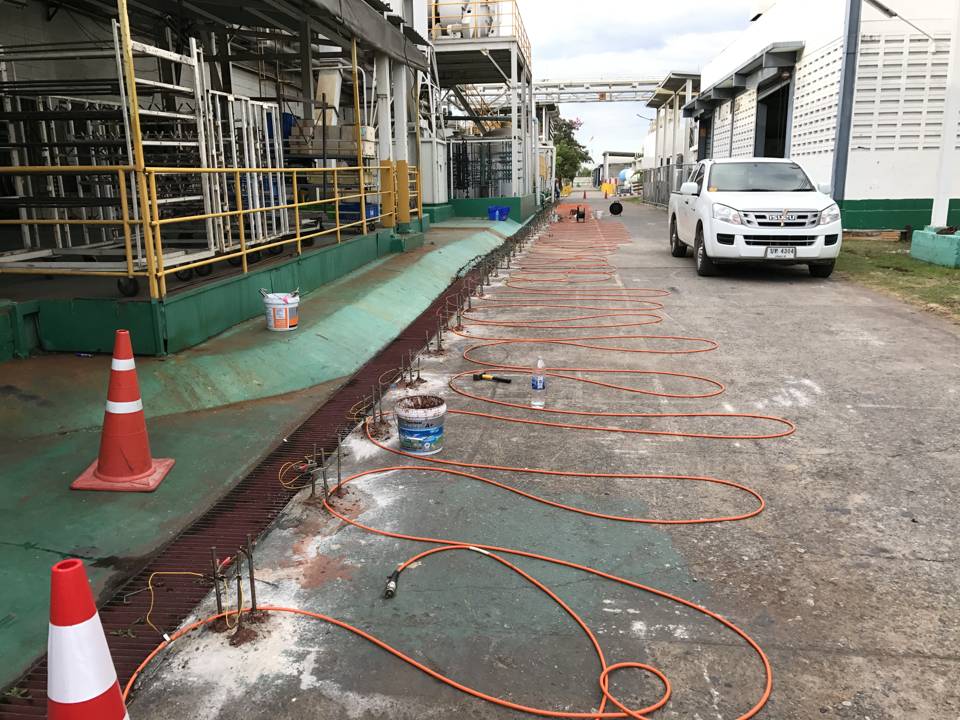
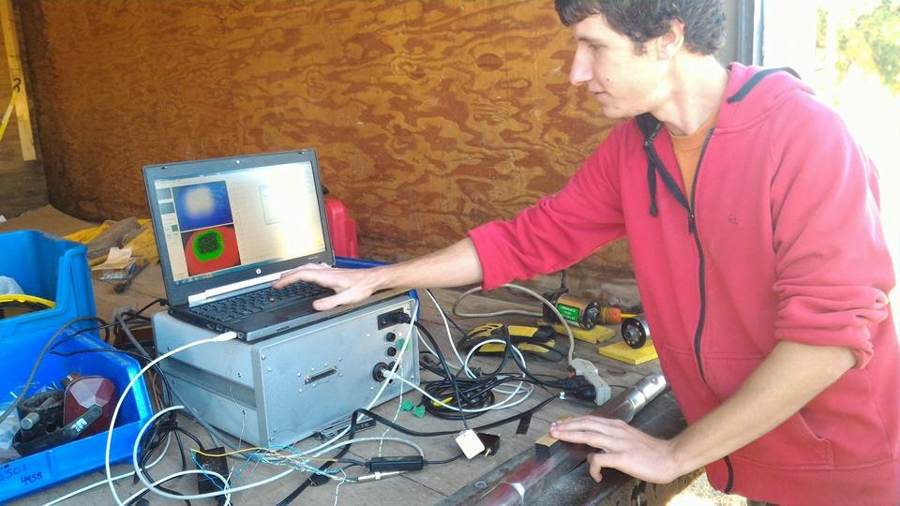
- ③ Scan สแกนด้วย ERI เพื่อหาบริเวณที่ผิดปกติ
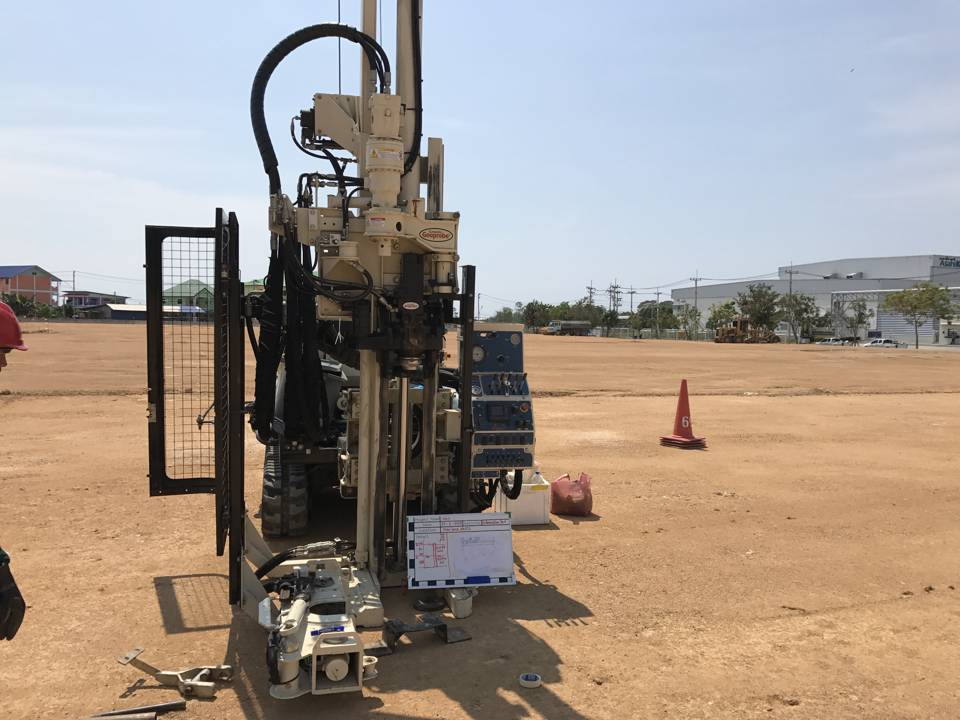
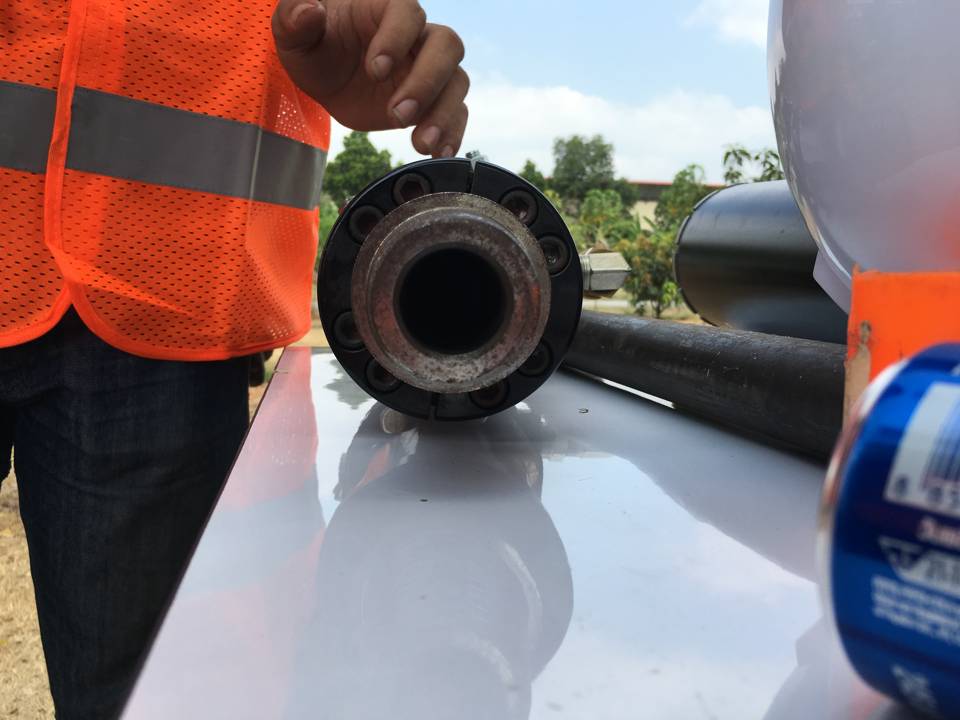
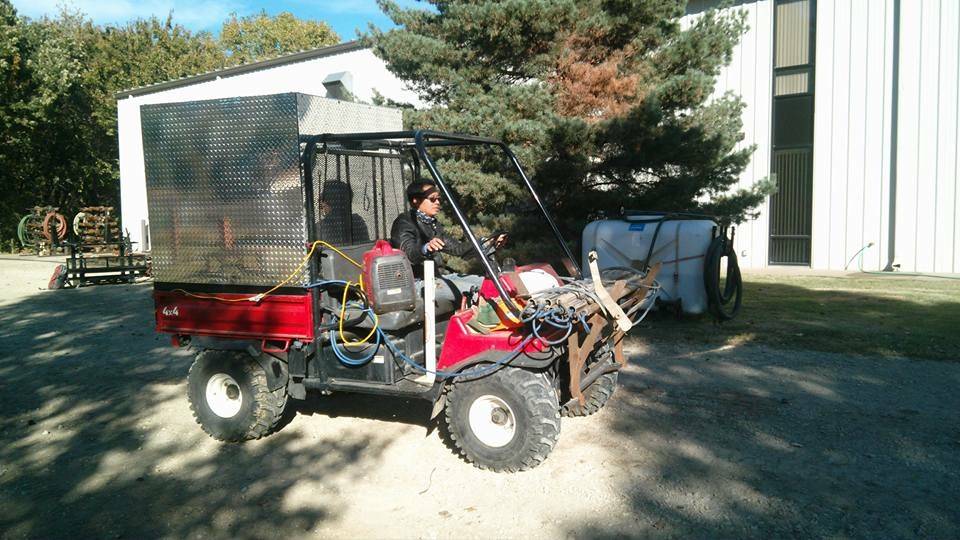
- ④ เข้าพื้นที่ รถเจาะ Geoprobe กดก้านเจาะลงตรงจุดที่กำหนด
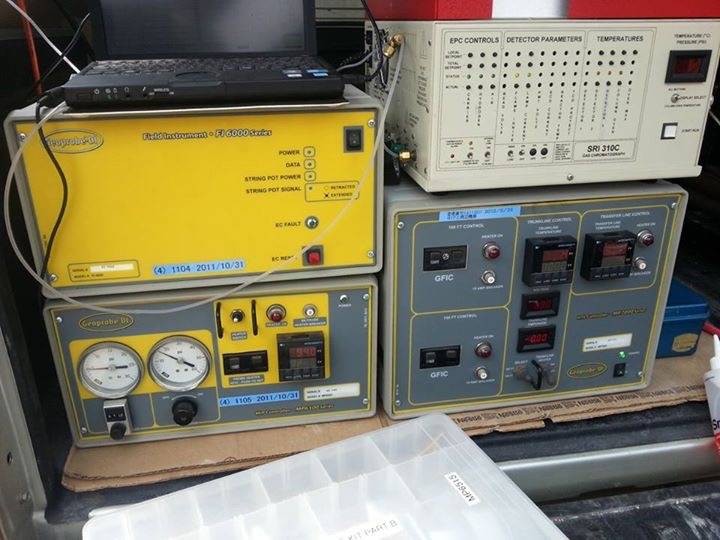
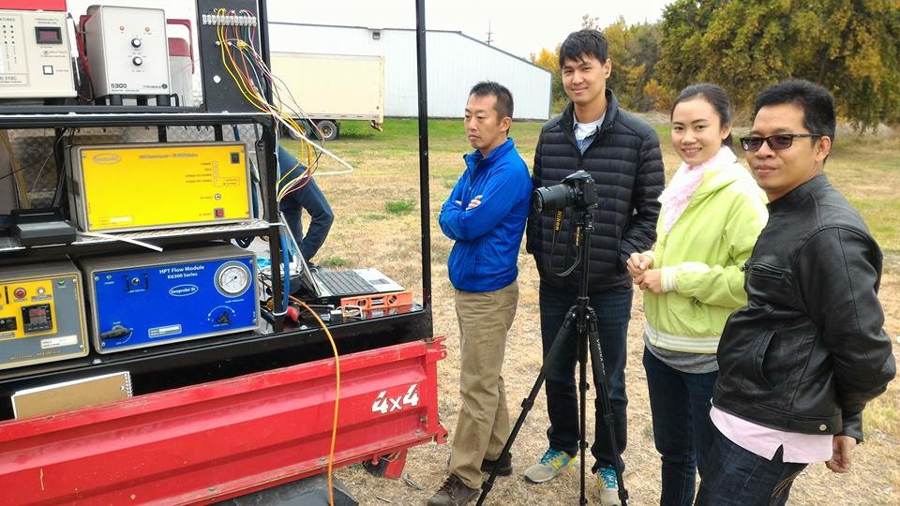
- ⑤⑥ Sense MIP และ HPT ตรวจวัดตามความลึกแบบเรียลไทม์
- ⑦ Sample ดิน เจาะเก็บตัวอย่างดินในช่วงที่พบสัญญาณ
- ⑧ Sample น้ำ เก็บตัวอย่างน้ำใต้ดินด้วย SP16
- ⑨ Model นำข้อมูลทั้งหมดเข้าสู่แบบจำลอง และพยากรณ์ล่วงหน้า 5 และ 10 ปี
ลดงบประมาณการสำรวจได้มากกว่าร้อยละ 60 และลดระยะเวลาได้มากกว่าร้อยละ 80 เมื่อเทียบกับการเก็บตัวอย่างแบบตาราง
An RE EARTH strength
Contamination modeling and future prediction
Now → In 5 years without treatment → In 10 years without treatment → After treatment
We combine ERI scans, MIP and HPT measurements, depth-discrete soil results and SP16 groundwater results to build a 3D model of the soil layers and contamination, using Surfer contouring and mapping software and the Groundwater Modeling System (GMS) by Aquaveo, to calculate contaminant transport with groundwater flow and predict future conditions.
Specifications
- Input data: ERI · MIP · HPT · Soil samples · SP16
- Software: Surfer · GMS (Aquaveo)
- Outputs: 3D extent · Contaminant mass · 5- / 10-year forecasts
Benefit: Management and regulators can clearly see how far contaminants will spread if no action is taken and how much will remain after treatment, so remediation options can be compared and investment decisions made on the basis of data.
Example results from an actual project
Results of integrating data ③–⑧ into the model
- Max. VOCs in groundwater: 99.37 mg/L (≈199× the standard)
- Max. VOCs in soil: 52.8 mg/kg (≈7× the standard)
- Source depth: 8–11 m
- Clay barrier layer: 12 m
- Contamination radius: <100 m
- Estimated subsurface VOC mass: 4.31 t
This dataset was used to design the colloidal activated carbon injection ⑩ and to locate the performance monitoring wells ⑪.
From field data to a predictive model
- ③ Scan ERI scanning to locate anomalies
- ④ Mobilize Geoprobe rig pushes rods at the selected points
- ⑤⑥ Sense MIP and HPT measure in real time by depth
- ⑦ Sample soil Soil cores collected where signals were found
- ⑧ Sample water Groundwater samples collected with the SP16
- ⑨ Model All data fed into the model to forecast 5 and 10 years ahead
Investigation budgets reduced by more than 60% and timeframes by more than 80% compared with grid sampling.